Backtesting
Does your strategy hold up when markets get ugly?
Our backtesting service runs your logic against up to five years of tick-level historical data, then hands you a report that shows the full picture — not just the peaks.

Backtesting
Our backtesting service runs your logic against up to five years of tick-level historical data, then hands you a report that shows the full picture — not just the peaks.
A backtest is only useful if it's honest. Our engine runs simulations on raw tick data, not resampled OHLC candles, which means slippage and spread costs are modelled realistically. We apply your broker's actual commission structure (imported from your broker profile) so the net P&L figures reflect what you'd have received — not a frictionless ideal. Every backtest run is stored permanently in your account; you can compare run #1 against run #14 to see exactly how a parameter tweak affected drawdown. We do not selectively show you the best window. The default report covers the full requested date range, and if you ask us to show only a good period, we'll tell you why that's not something we'll do.
Six data layers in every report — all exportable as CSV or PDF.
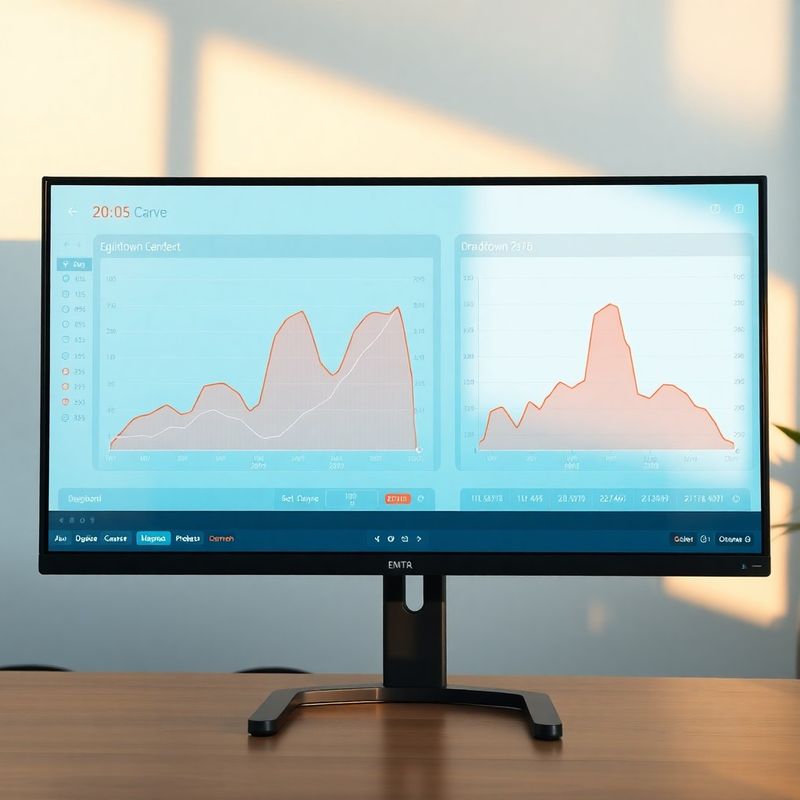
Peak-to-trough equity curves across the full simulation window, with the ten deepest drawdown episodes individually annotated — so you know not just the worst figure, but when it happened and how long recovery took.
Separate win-rate and average win/loss ratio by instrument, by session (Asian / European / US), and by day of week. Patterns you'd never see in a headline figure often appear clearly at this granularity.
Realistic slippage estimates based on tick-level spread data, plus your broker's actual commission table applied trade by trade. The bottom line reflects the market you'd have actually traded in.
We vary your key parameters ±20% in a grid and plot how performance metrics respond. If your strategy only works in a narrow corridor of inputs, you'll see that clearly before going live.
“I came in convinced my momentum strategy was solid — I'd tested it myself in a spreadsheet. The Ashford & Whitaker report showed me a 34% drawdown period in Q4 2022 that my spreadsheet had completely smoothed over. That information was worth more than any subscription fee.”
Mihai T., prop trader, Galați
Backtesting is a diagnostic tool, not a performance guarantee. A strategy that performed well on historical data can underperform in live markets due to structural market changes, regime shifts, or liquidity conditions that don't appear in historical records. We explain this clearly in every report header, and we will not frame a backtest result as a predictor of future returns. Our job is to give you the most accurate historical picture possible; your job is to decide whether that picture justifies live deployment. We recommend treating backtest results as a go/no-go filter, not as a forecast.
Upload your rules and get a full tick-level backtest report within three business days.
Start your backtest